Setting up the code
In this walkthrough, we’ll be leveraging the Google ADK integration. Let’s create a virtual env firstNote: Use python3.12 to create virtual environments
env. Activate it using the following command in your terminal
google_adk_futureagi.py) at your desired location and start by setting up the environment variables and imports
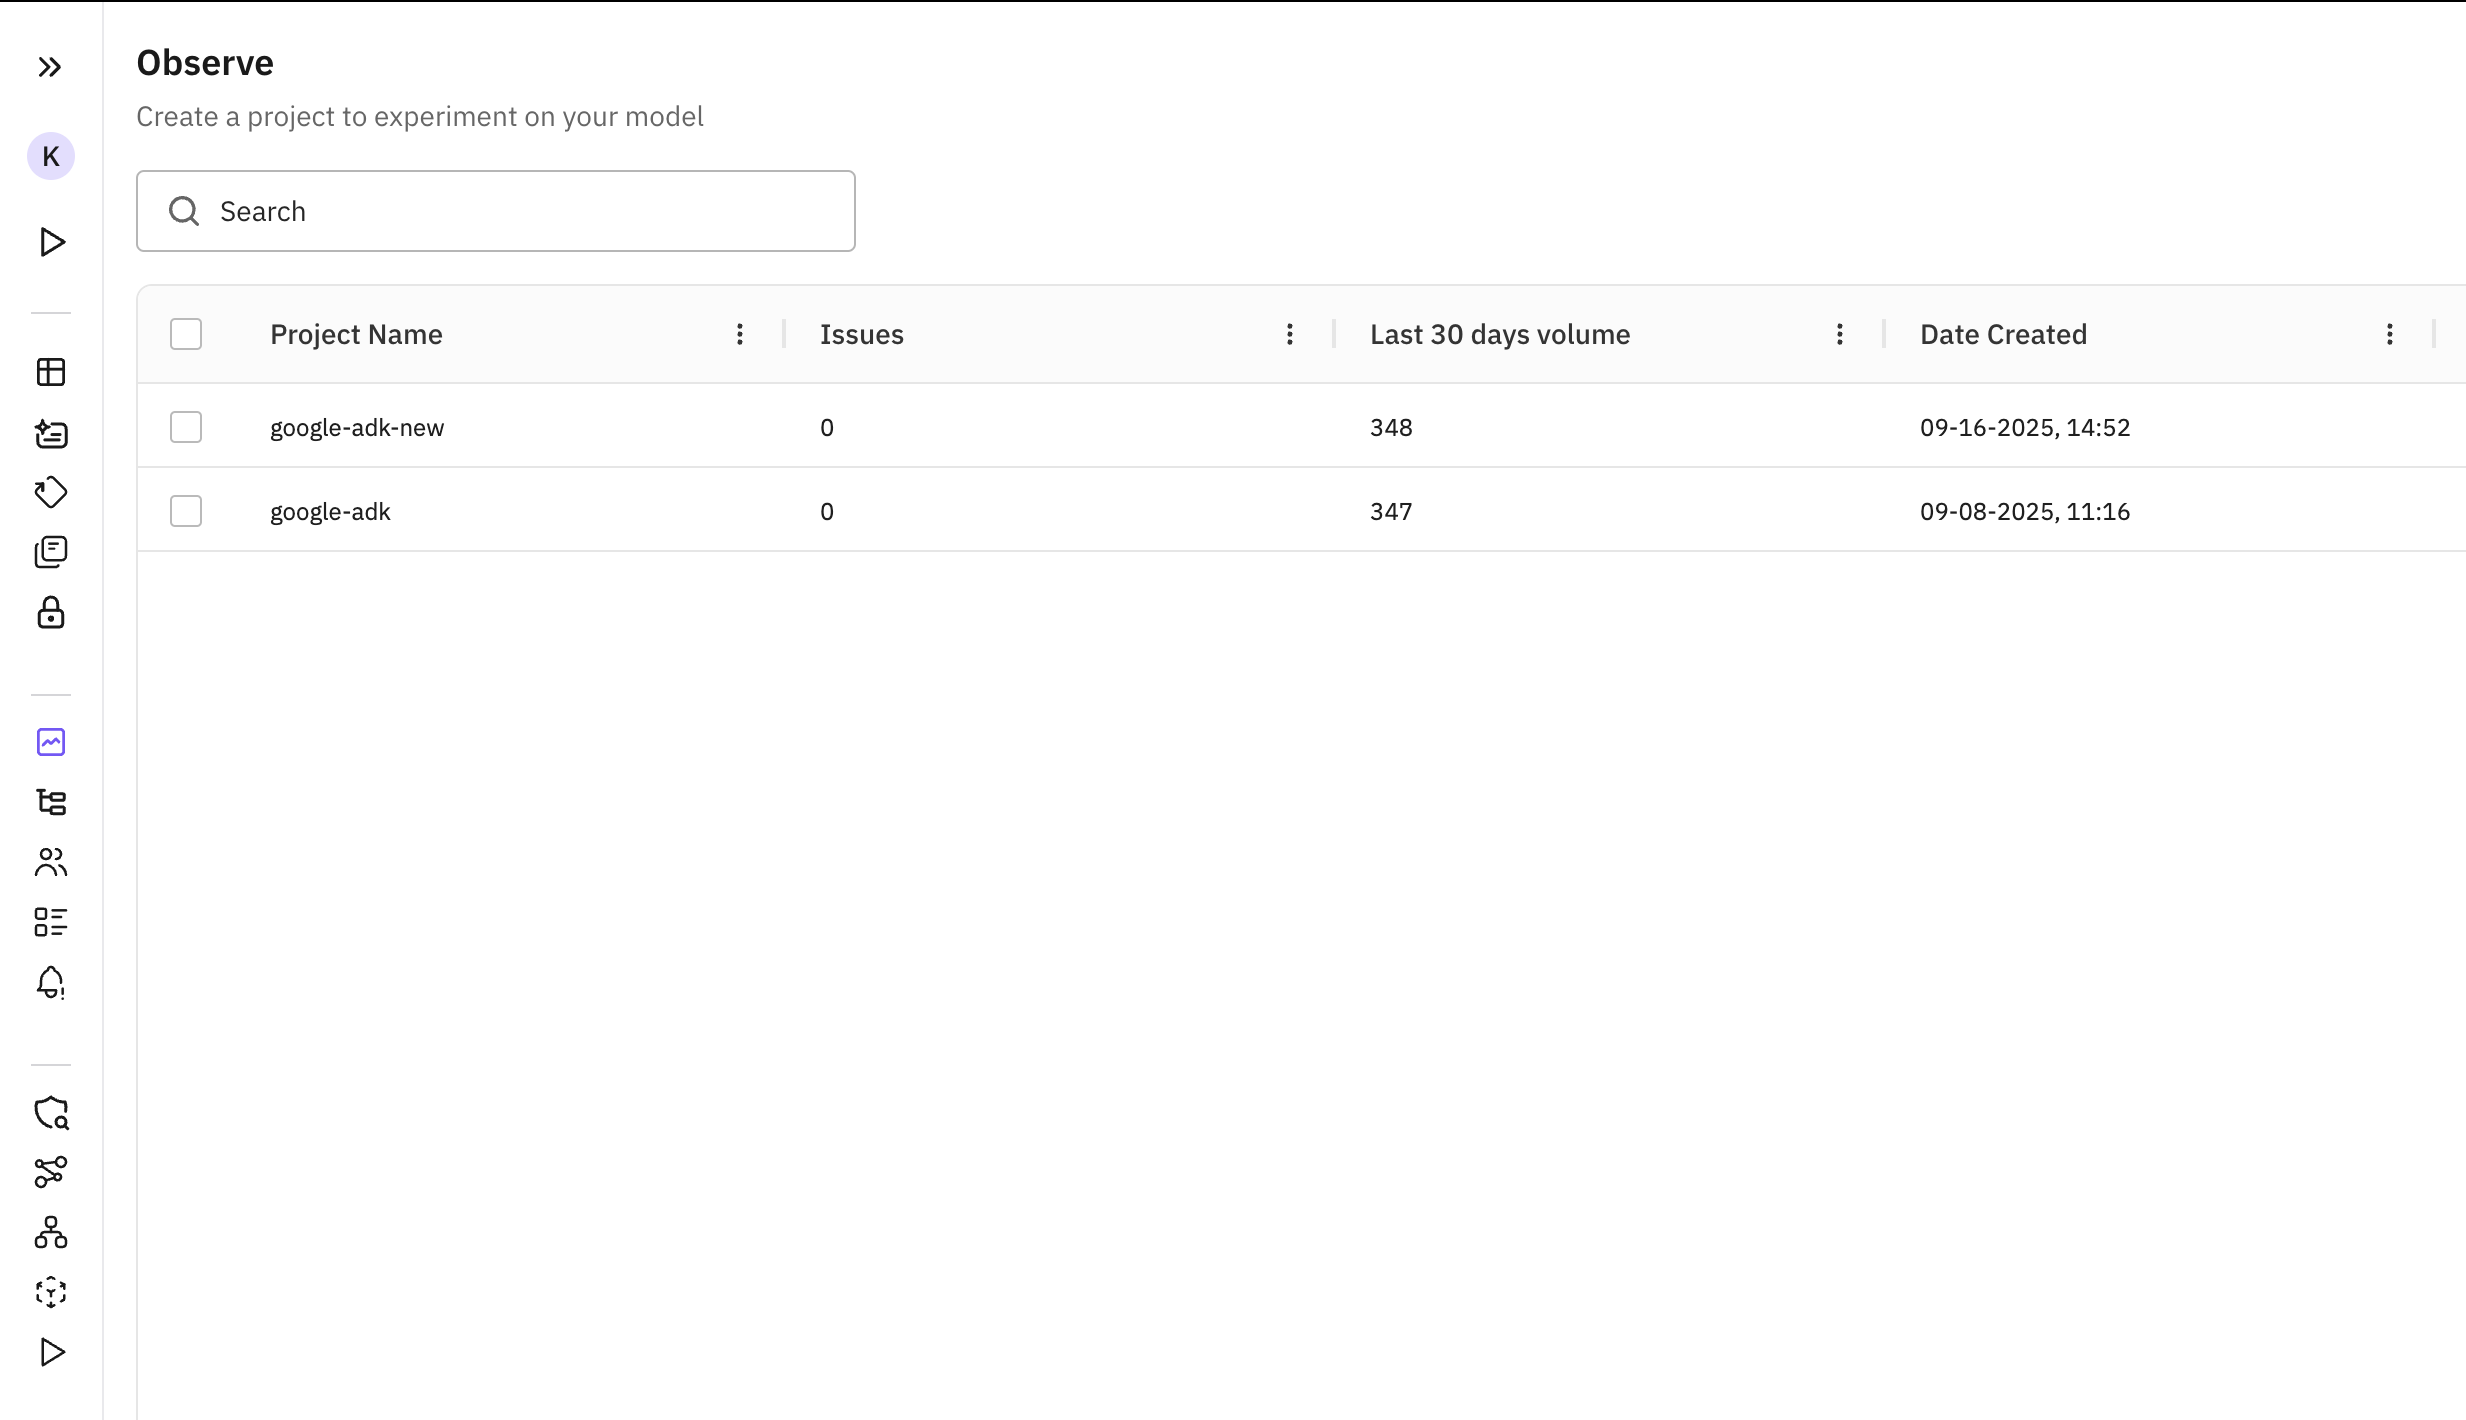
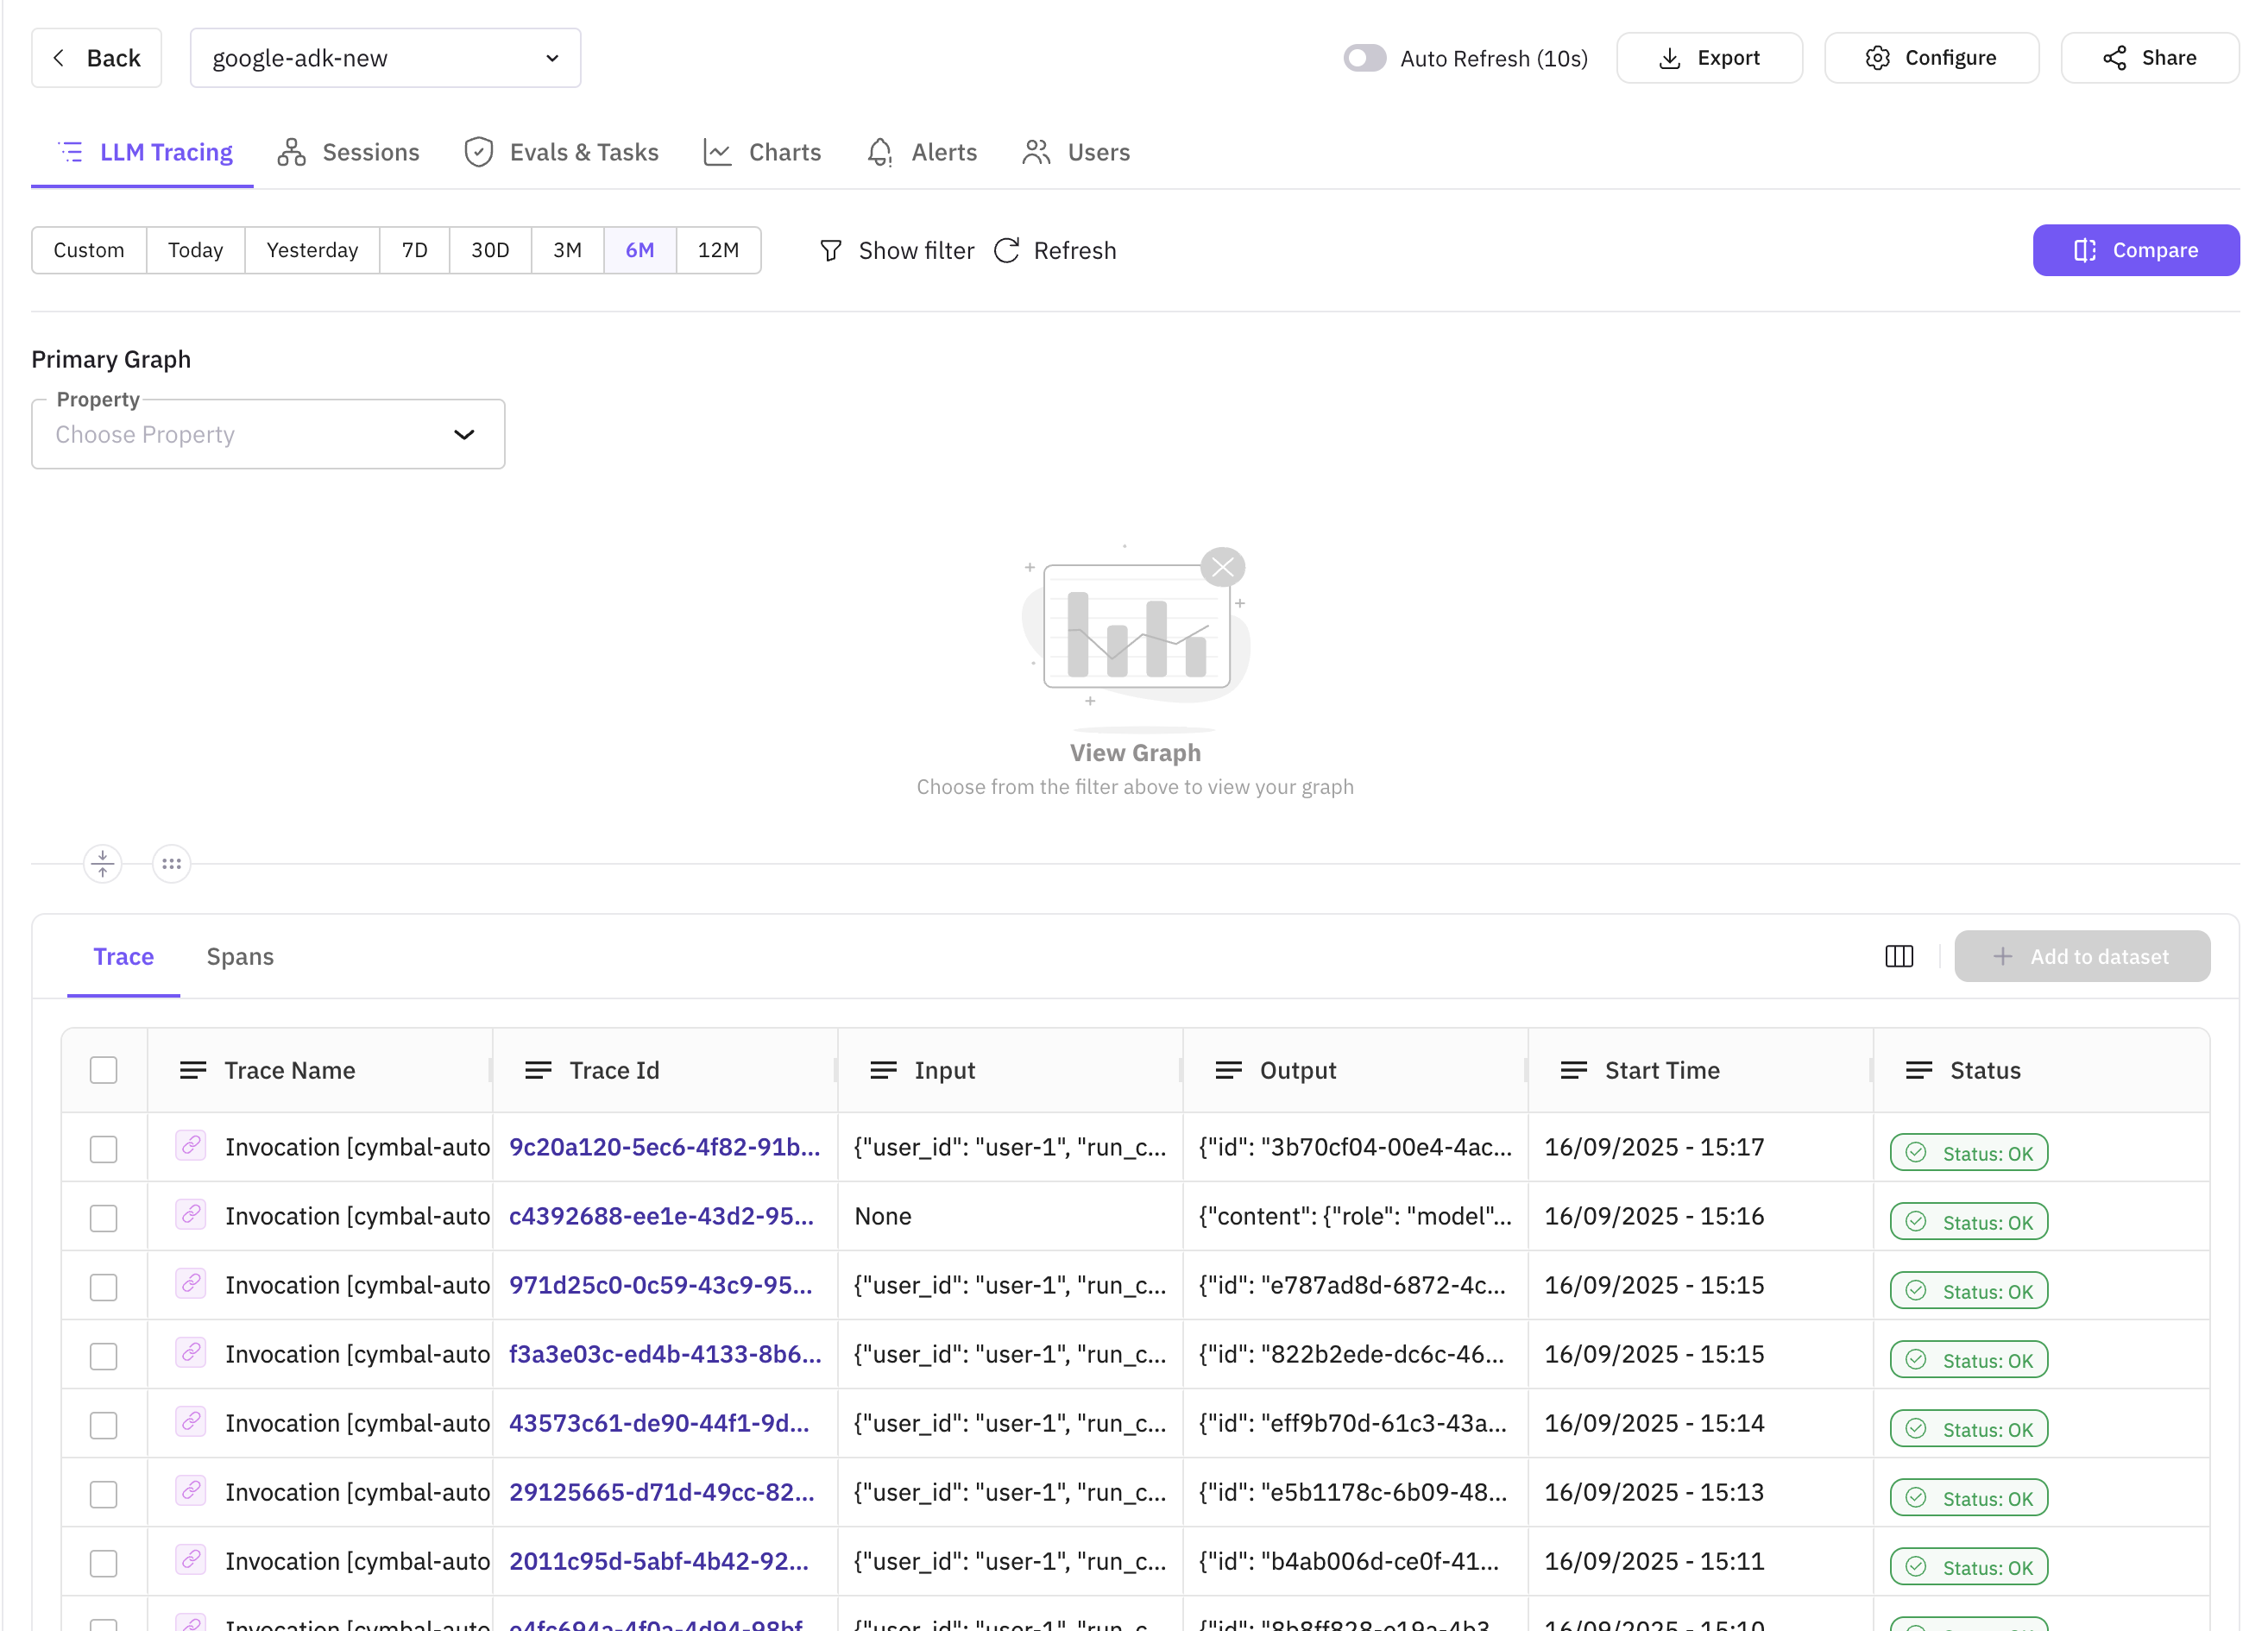
google-adk-new has been added in the Observe tab of the platform.
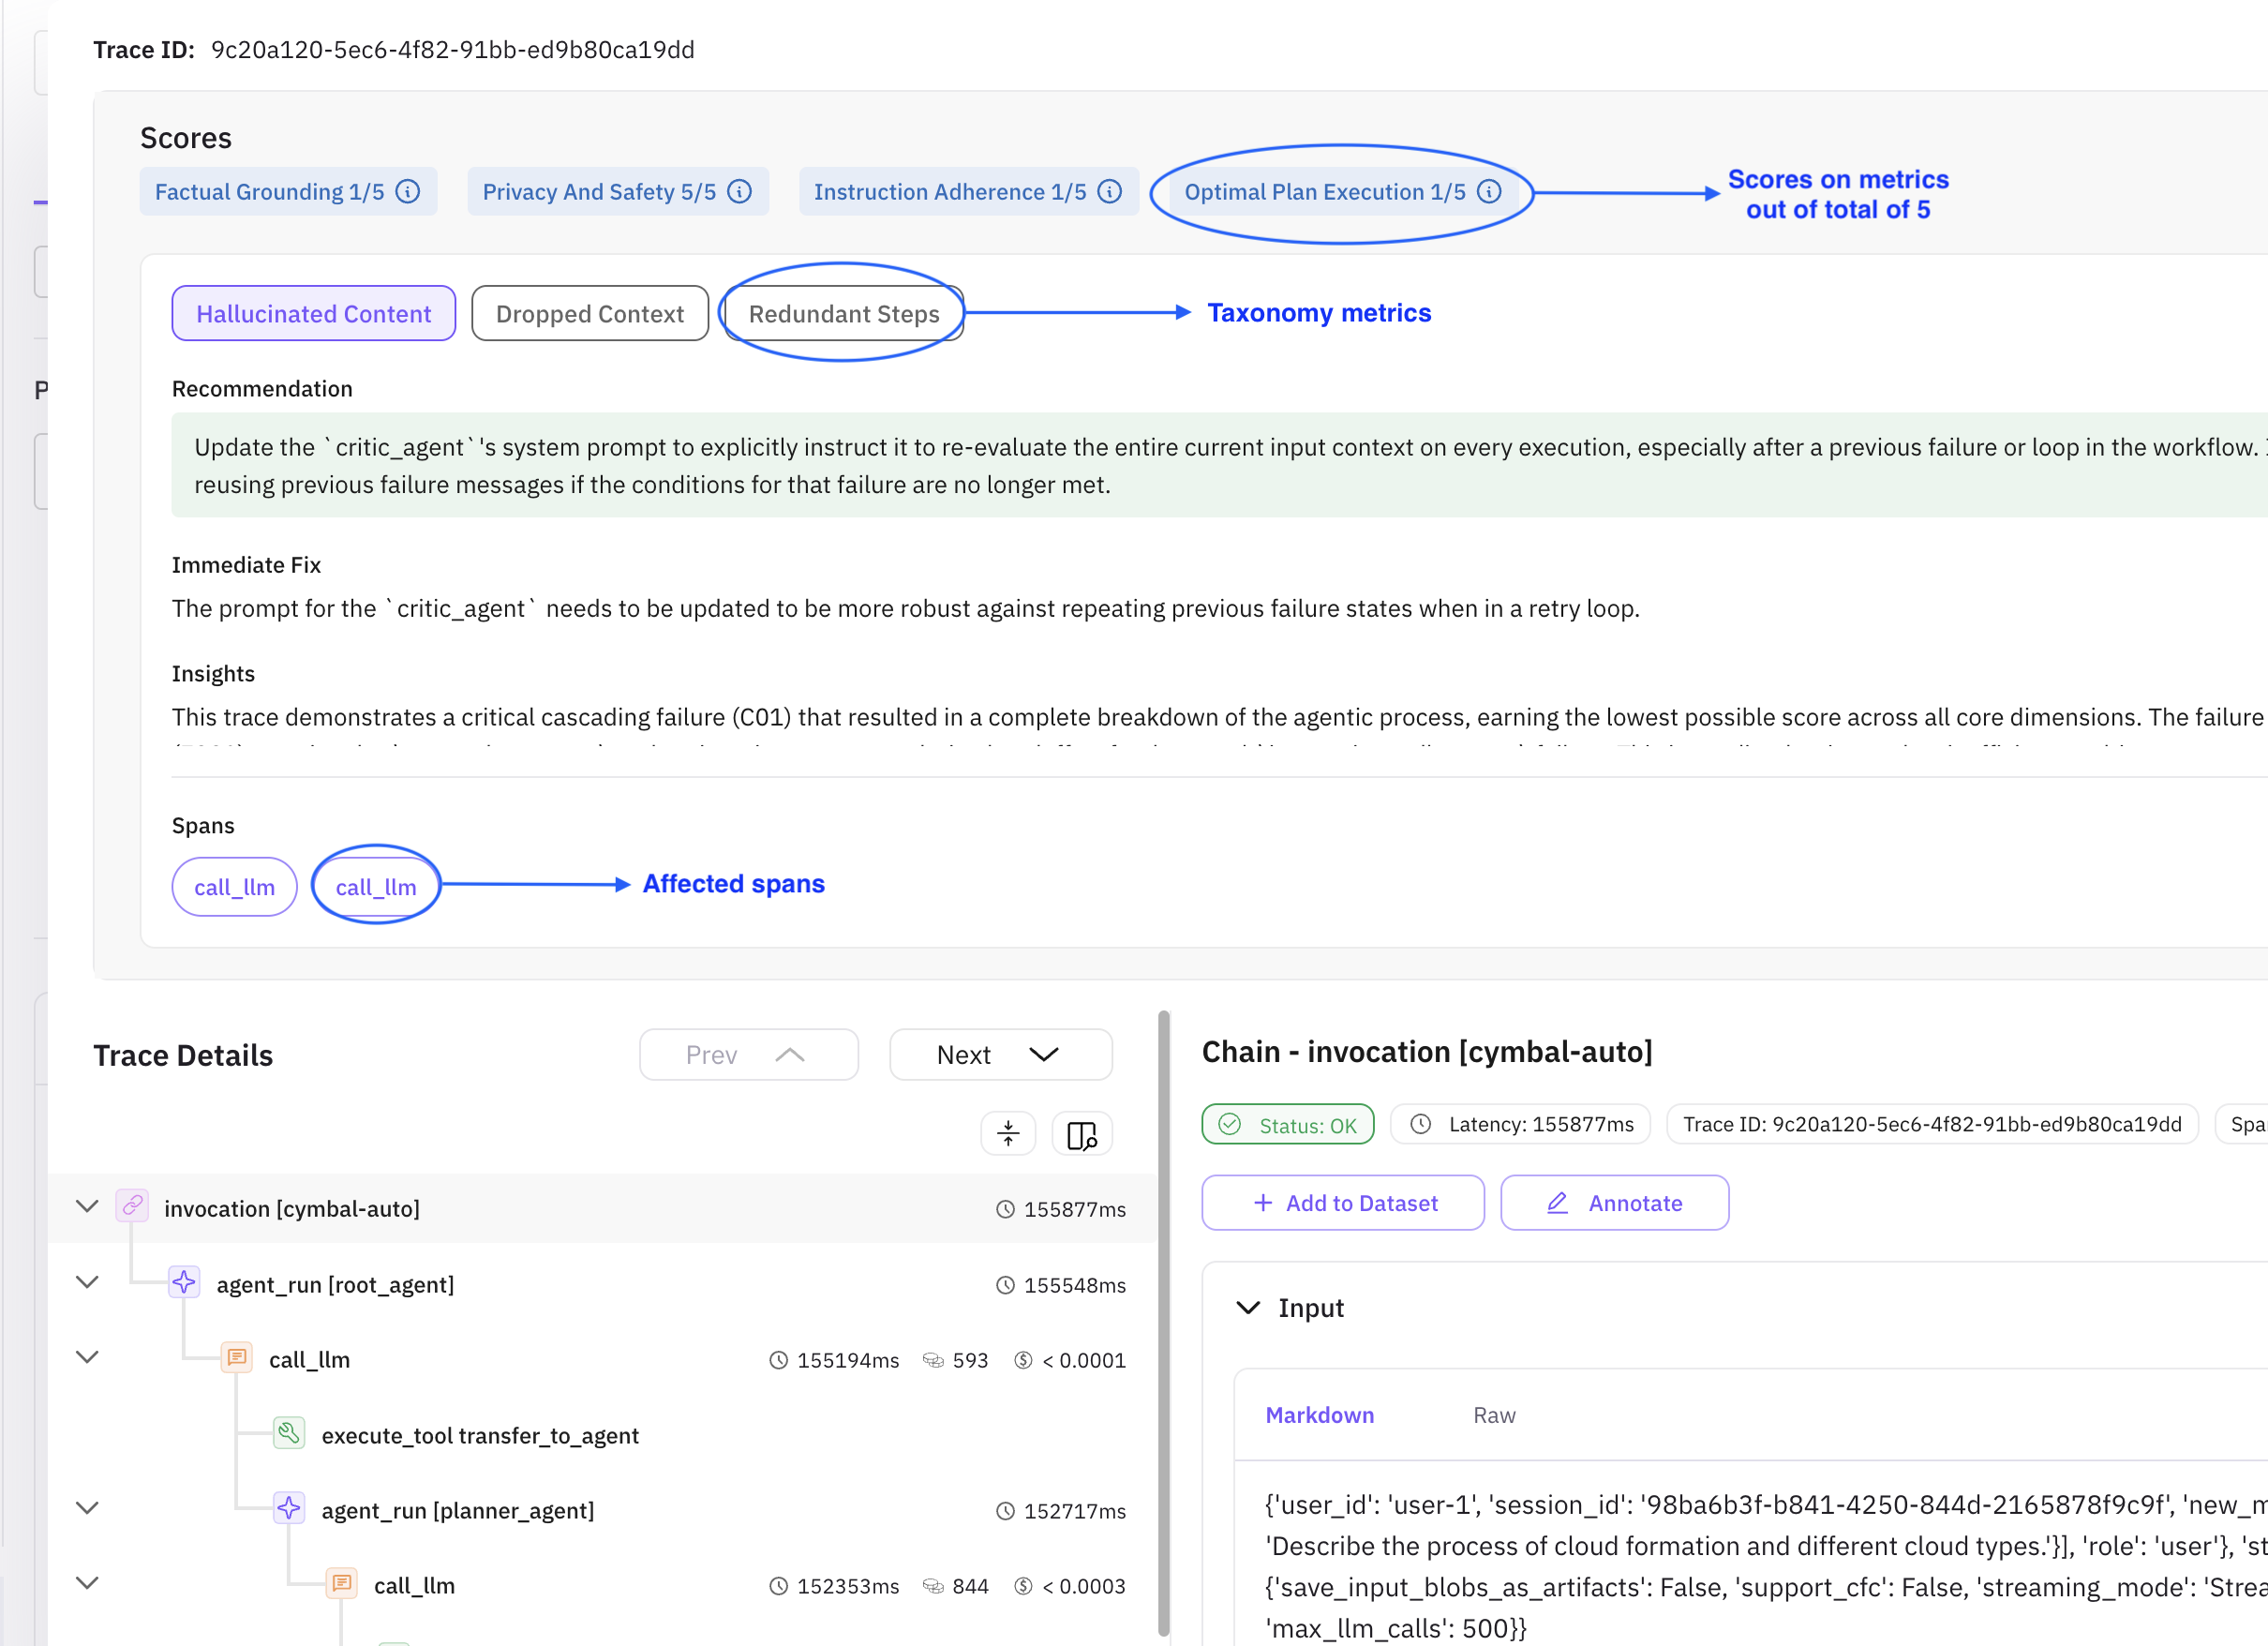
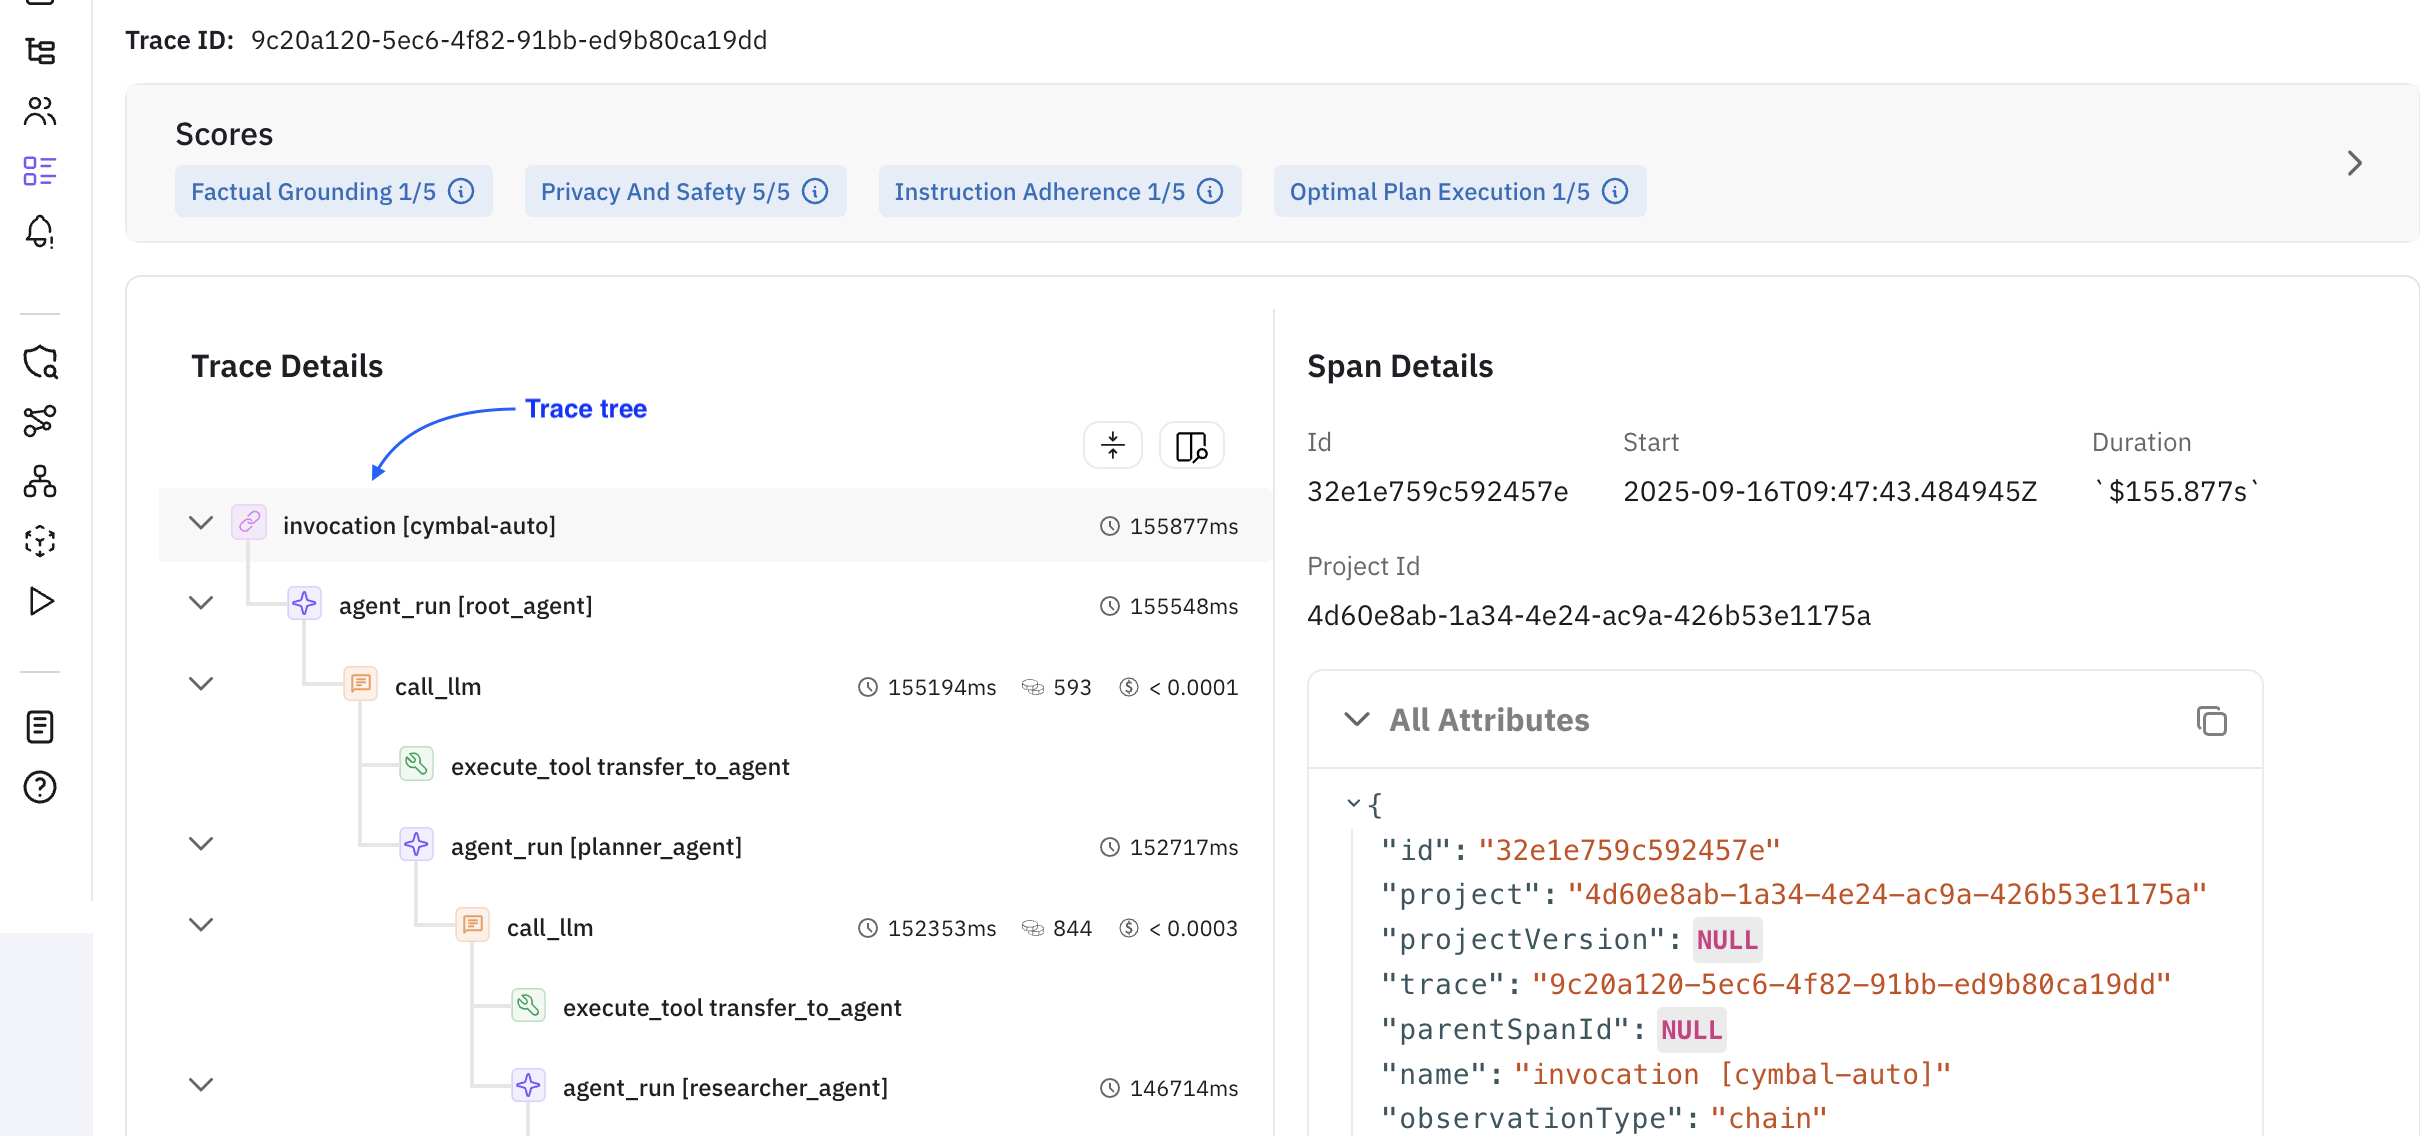
Scores
Each of the metrics mentioned are the grounds on which the agent performance is evaluated out of a score of 5. They are as follows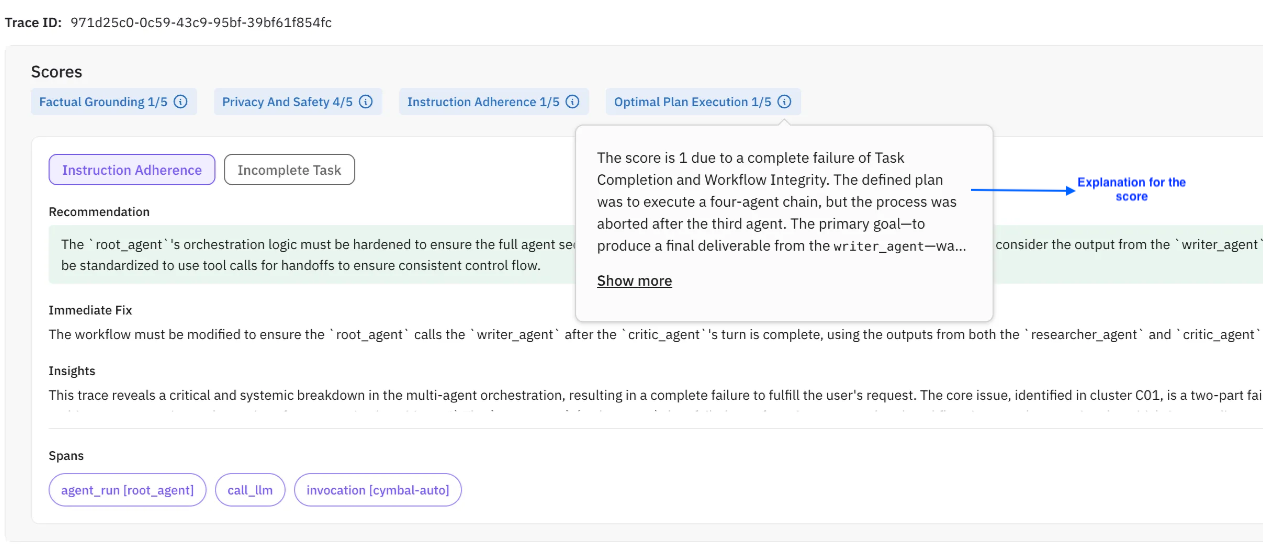
Clickable metrics
These are the taxonomy metrics. They indicate under which metric your agent needs improvement and are decided by the compass itself (ex: Instruction Adherence, Incomplete task etc.)Recommendation
This is a suggestion from the perspective of implementing a long term and robust fix. The recommendation may not always be the same as an immediate fix. In most of the cases, proceeding with the recommendation would be the best course of actionImmediate fix
This suggests a minimal functional fix. This fix may or may not necessarily align with the recommendationInsights
Insights are high level overview of the complete trace execution. They do not change with the currently active taxonomy metric and give a bird’s eye view of what your agent did during executionDescription
The description conveys what went wrong during the agentic exection. It also answers what happened in the errorEvidence
Evidences are the supporting snippets from the LLM response that was generated during the agentic executions. They can help you uncover edge cases/unforeseen scenarios that might’ve been missed during the development phaseRoot Causes
Indicates the underlying issue of an error occurence. This helps developers gain a better understanding of their agentic workflowsSpans
The list of affected spans. Each taxonomy metric can have different spans associated with it. You can click on the span to spot it in the trace treeSampling Rate
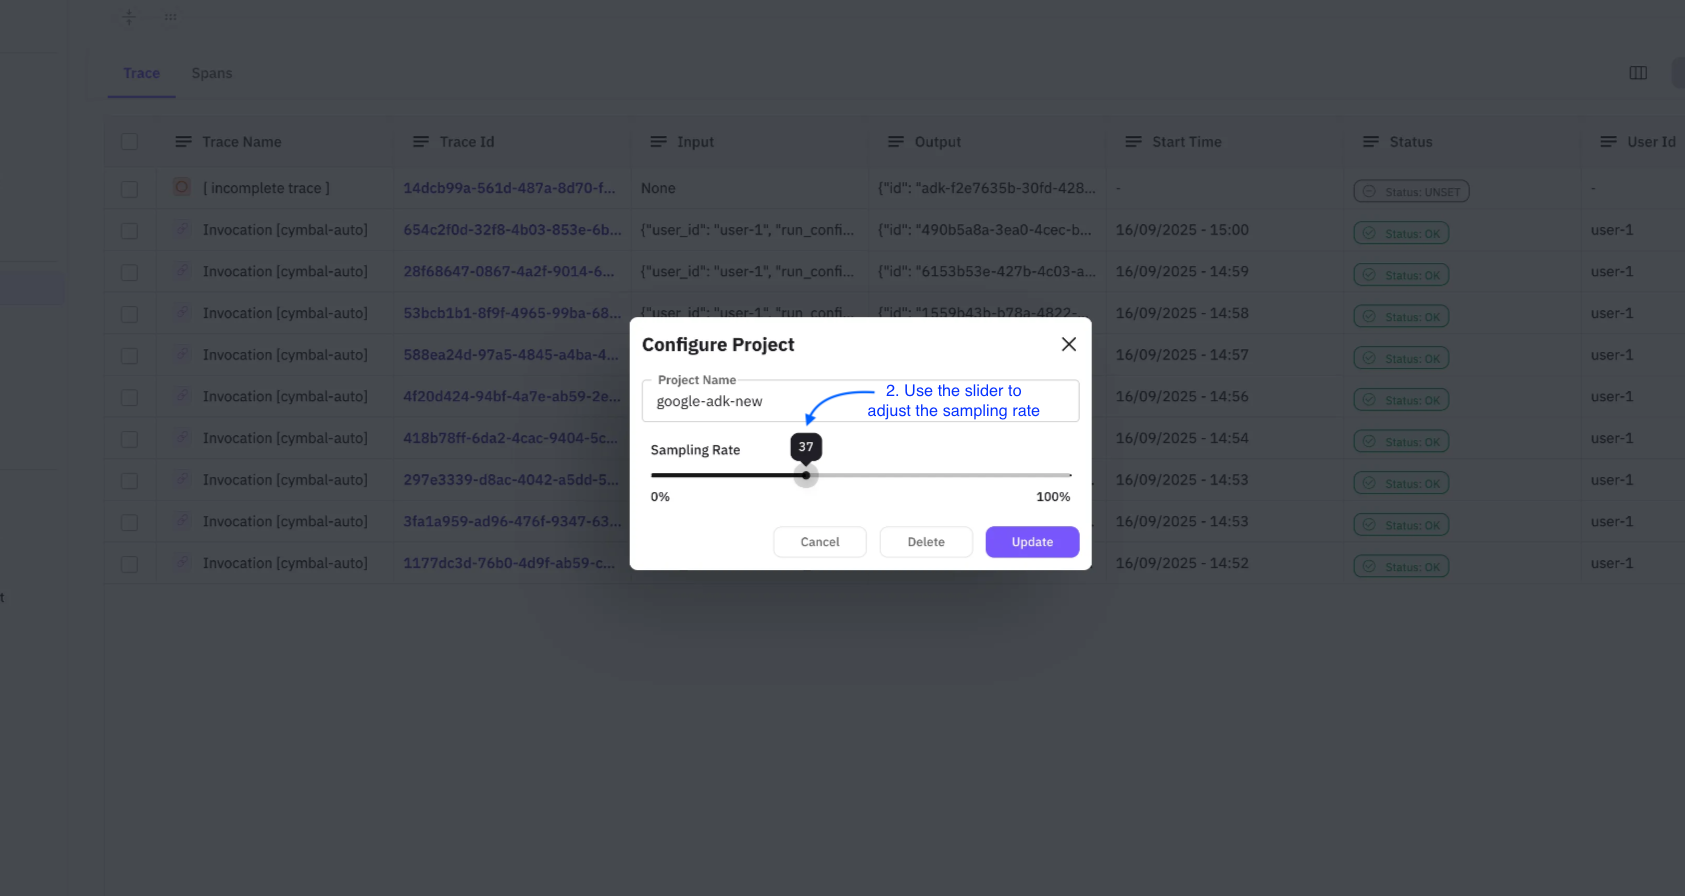
This is a special, user controlled parameter. It refers to what percentage of traces should the compass run on. Based on the sampling rate, the compass picks up traces at random to generate insights. Sampling rate can be configured in two simple steps mentioned belowNote: The adjusted/updated sampling rate will be applicable for upcoming traces only and not on the currently present or previously added traces
- Step 1: Click on configure button on the top right corner of the observe screen
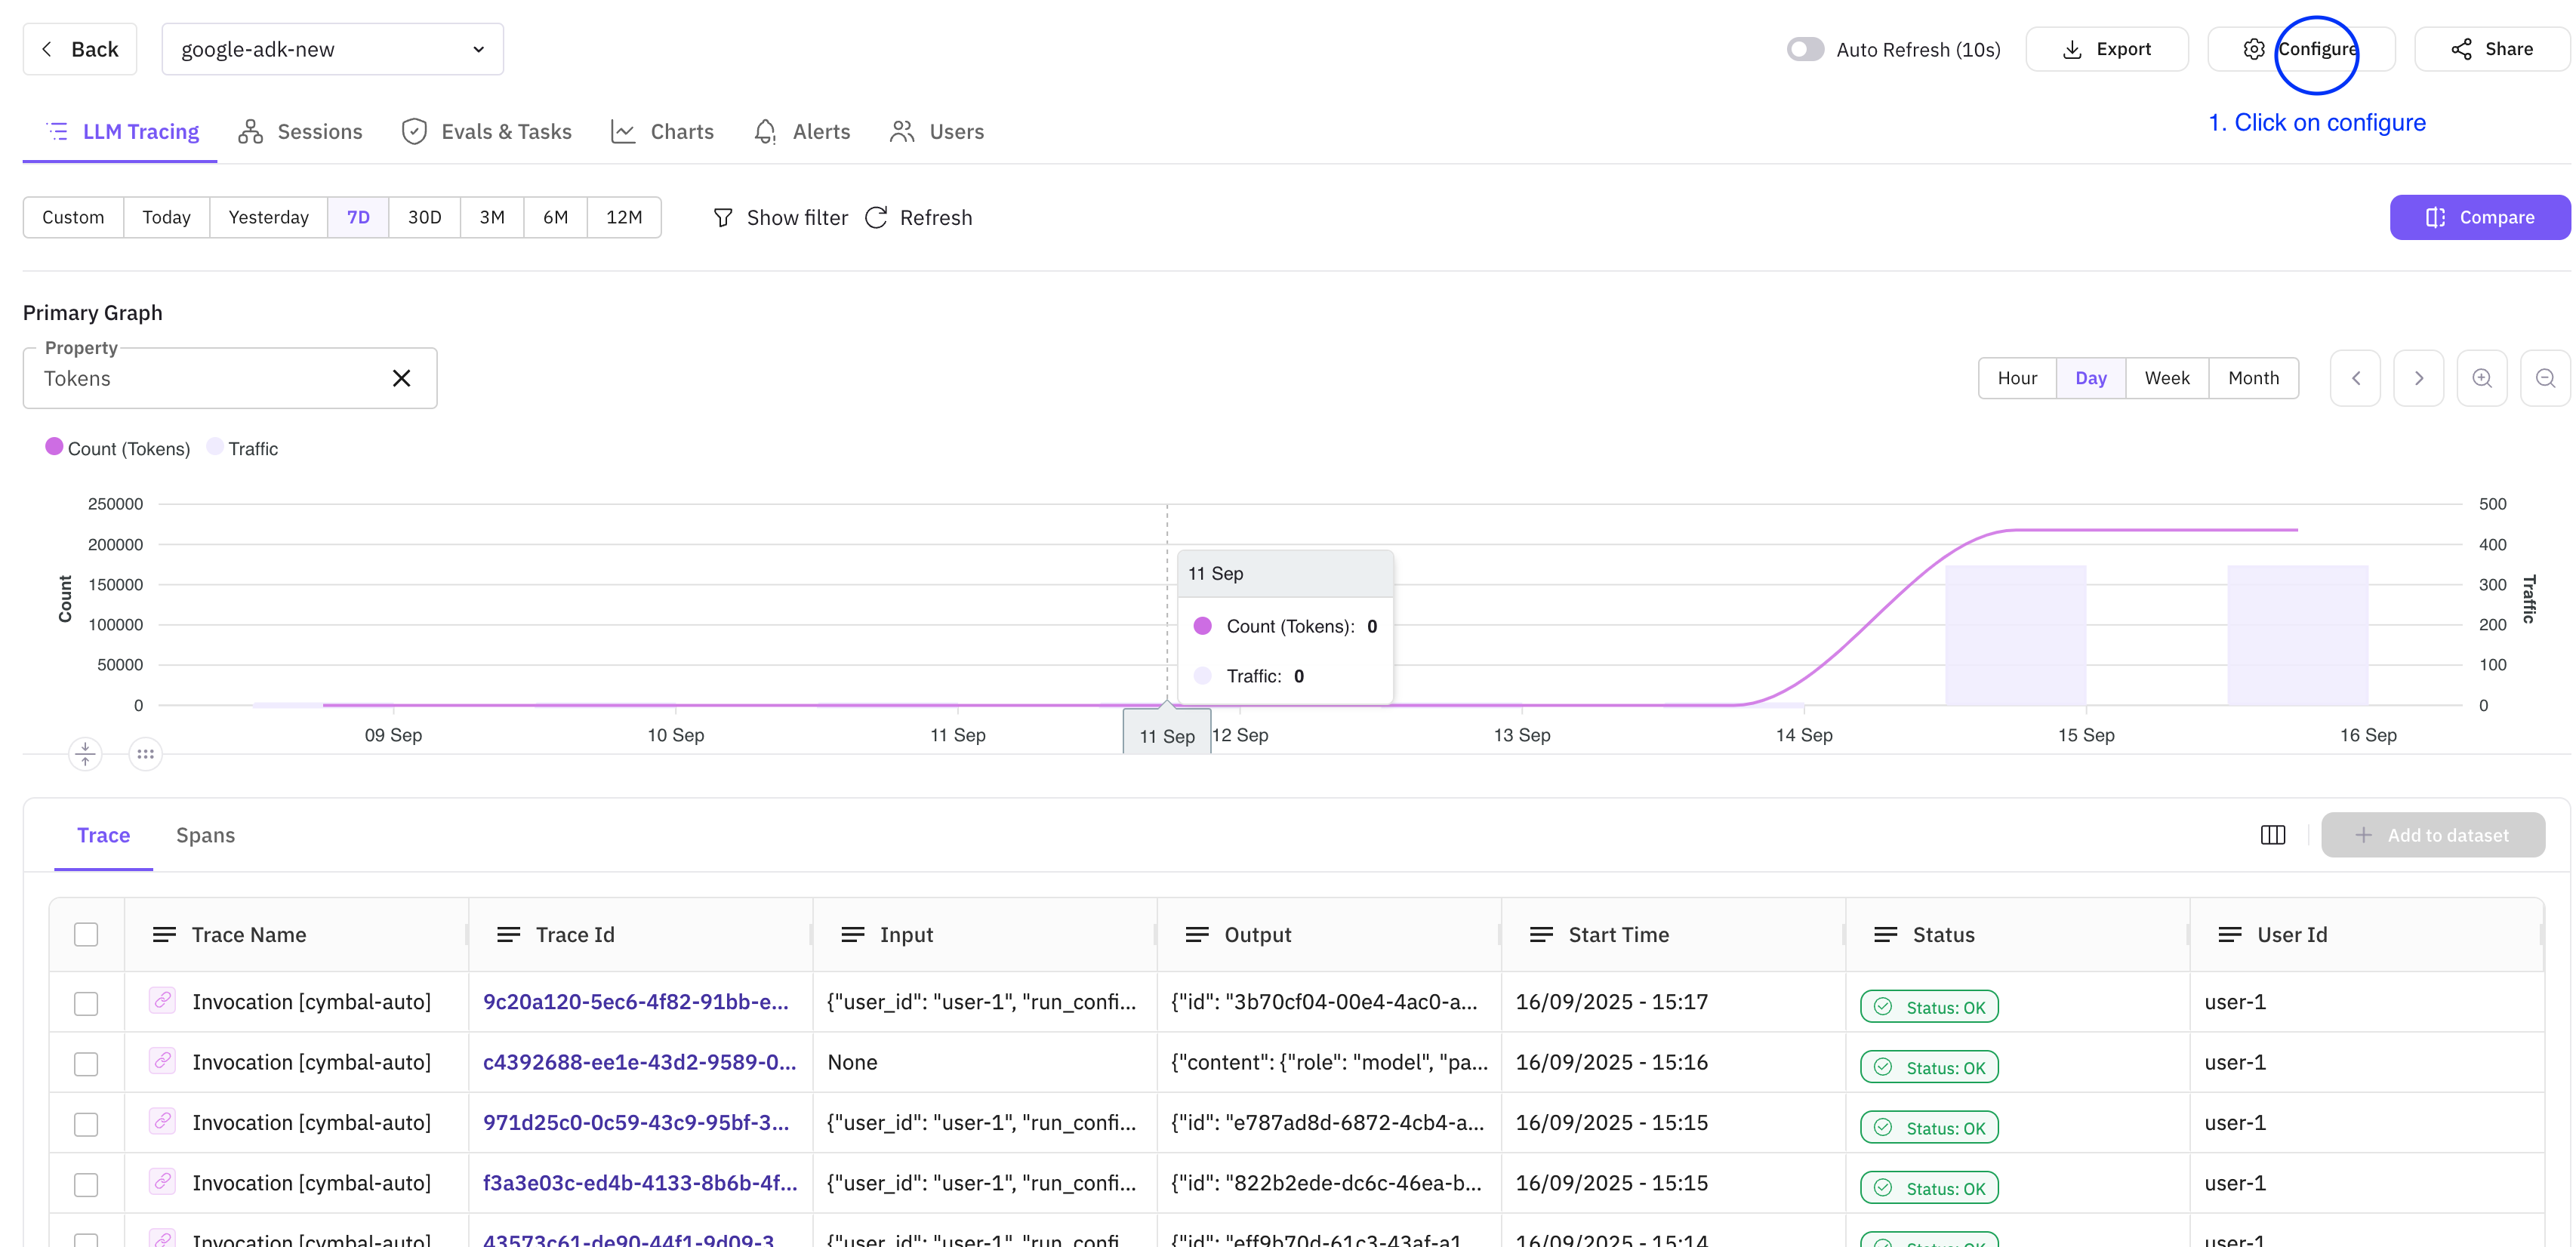
- Step 2: Use the slider to adjust the sampling rate according to your needs. Click on update to save
Feed Tab
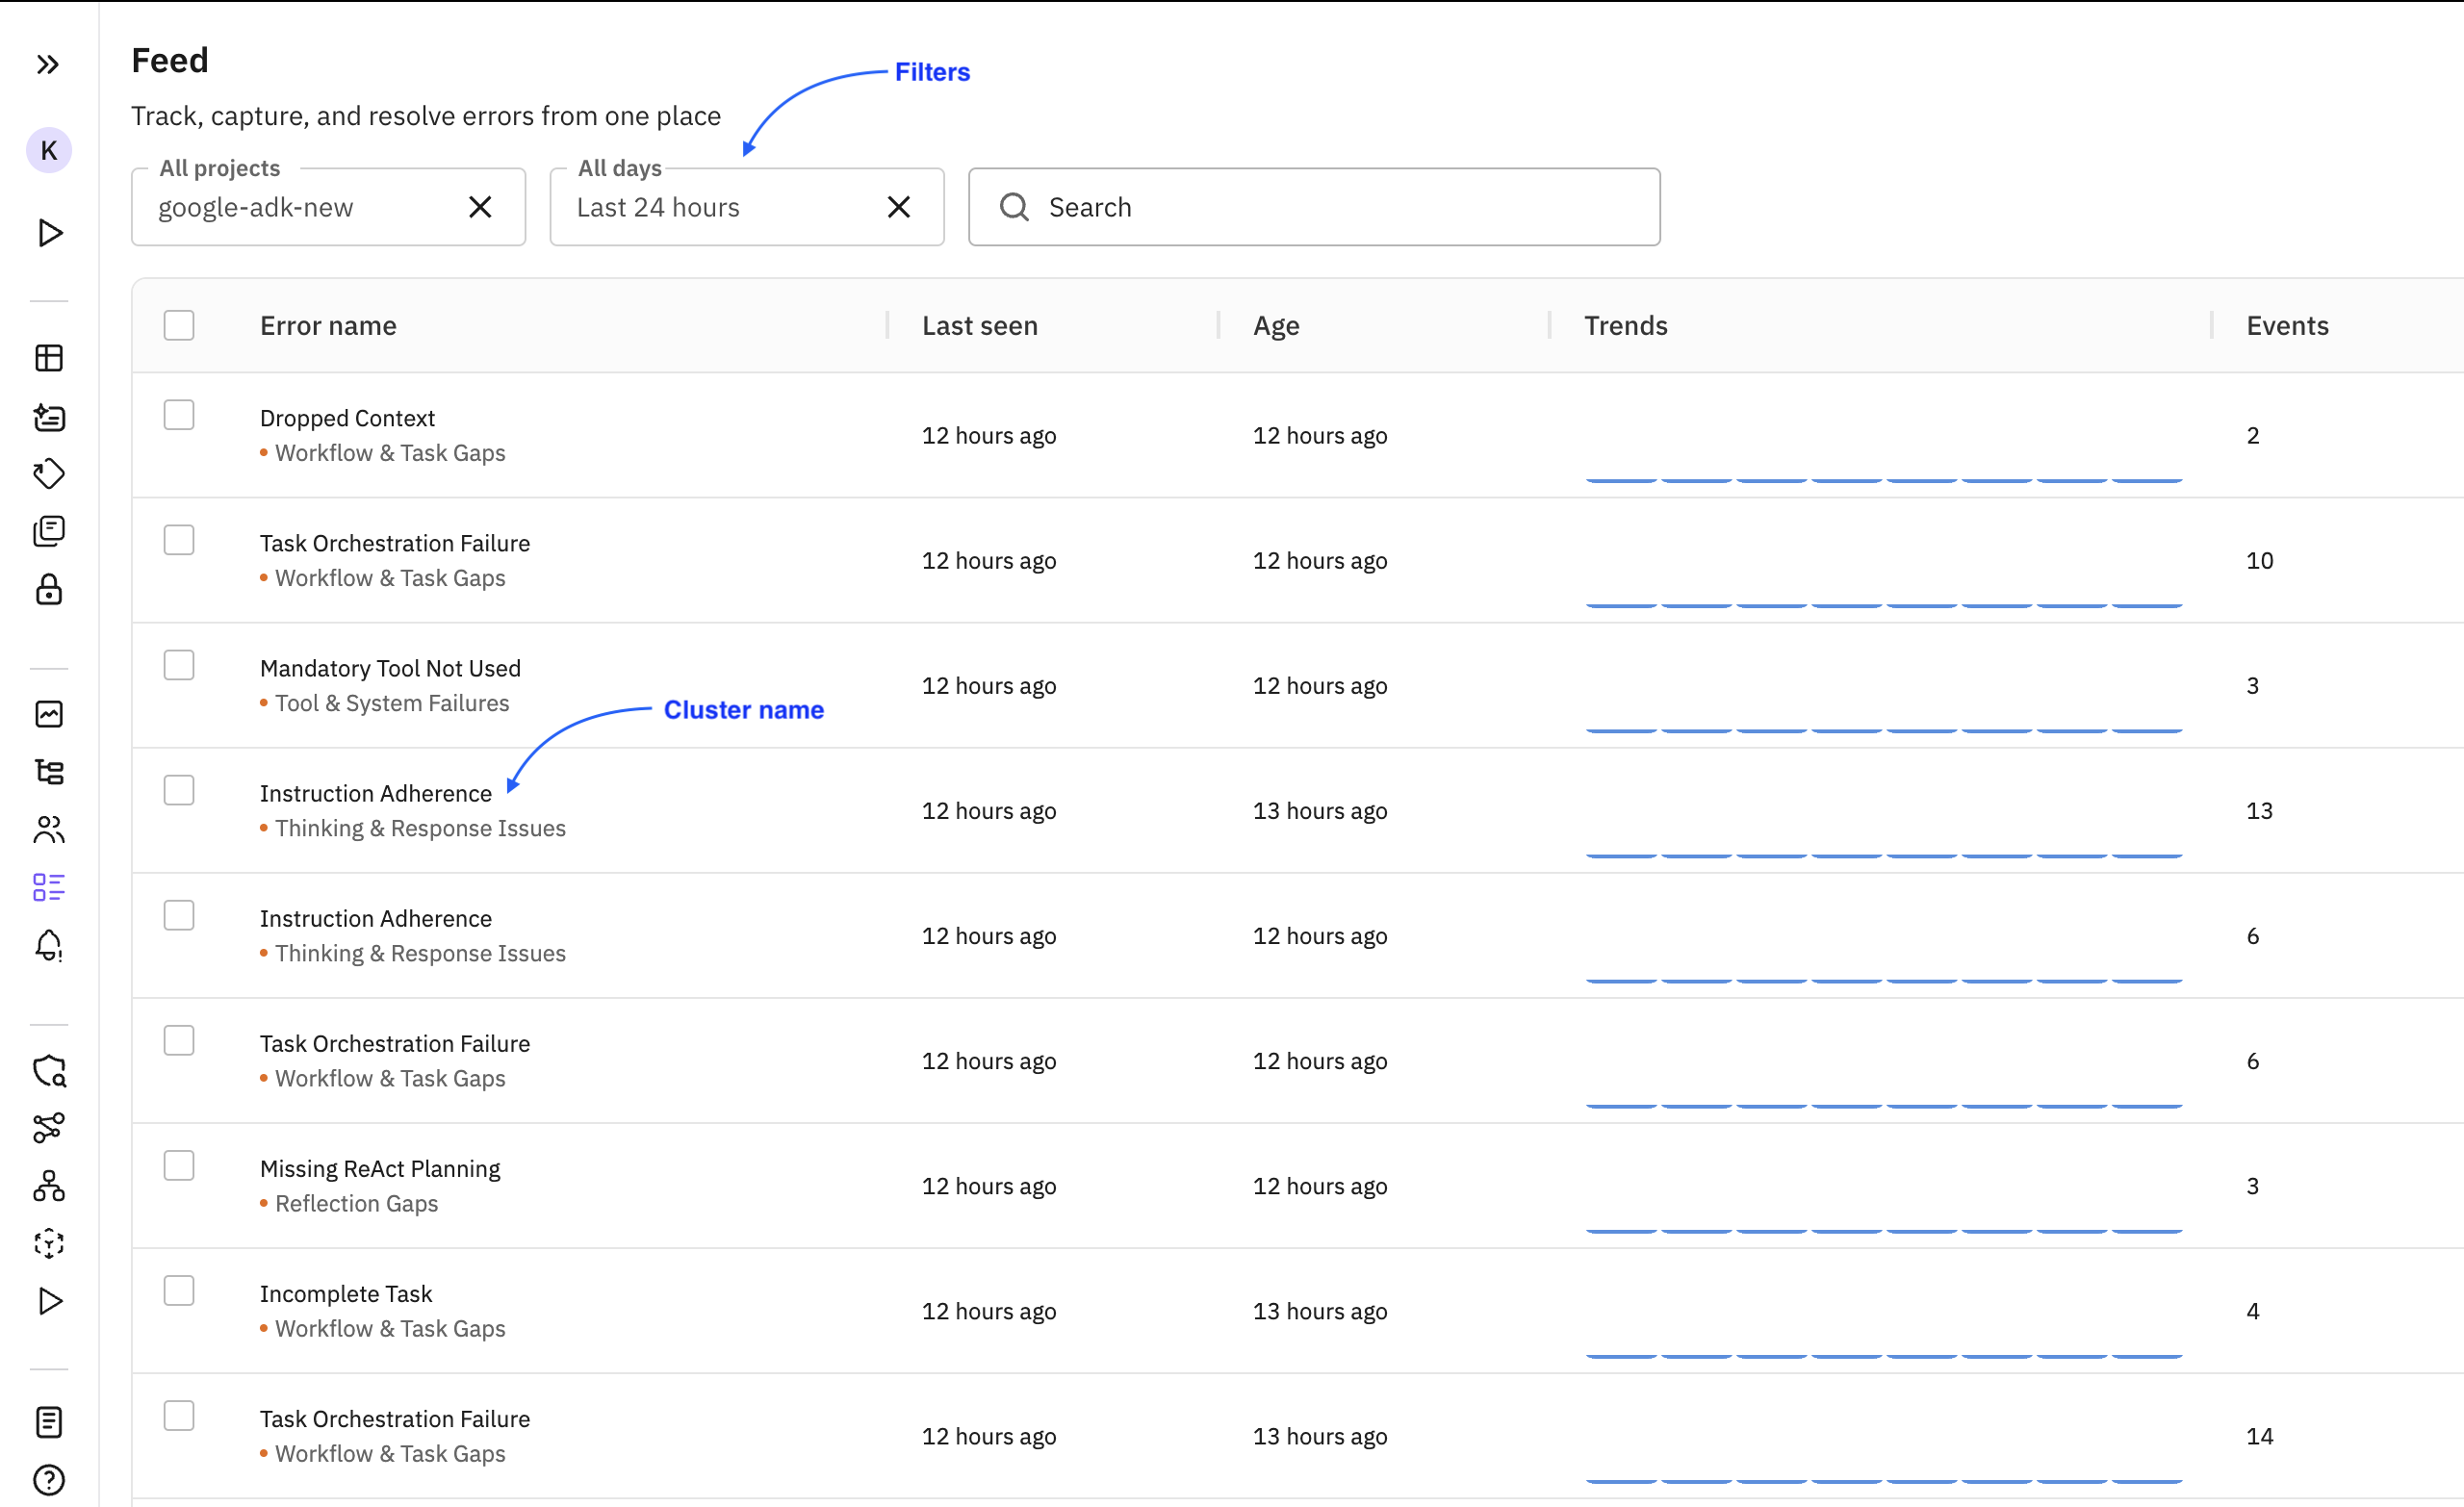
All the errors identified by the compass are grouped together and can be viewed under theFeed tab of the platform. The Feed tab shows all the errors identified by the compass in one place. The screen of the same looks like this
Cluster
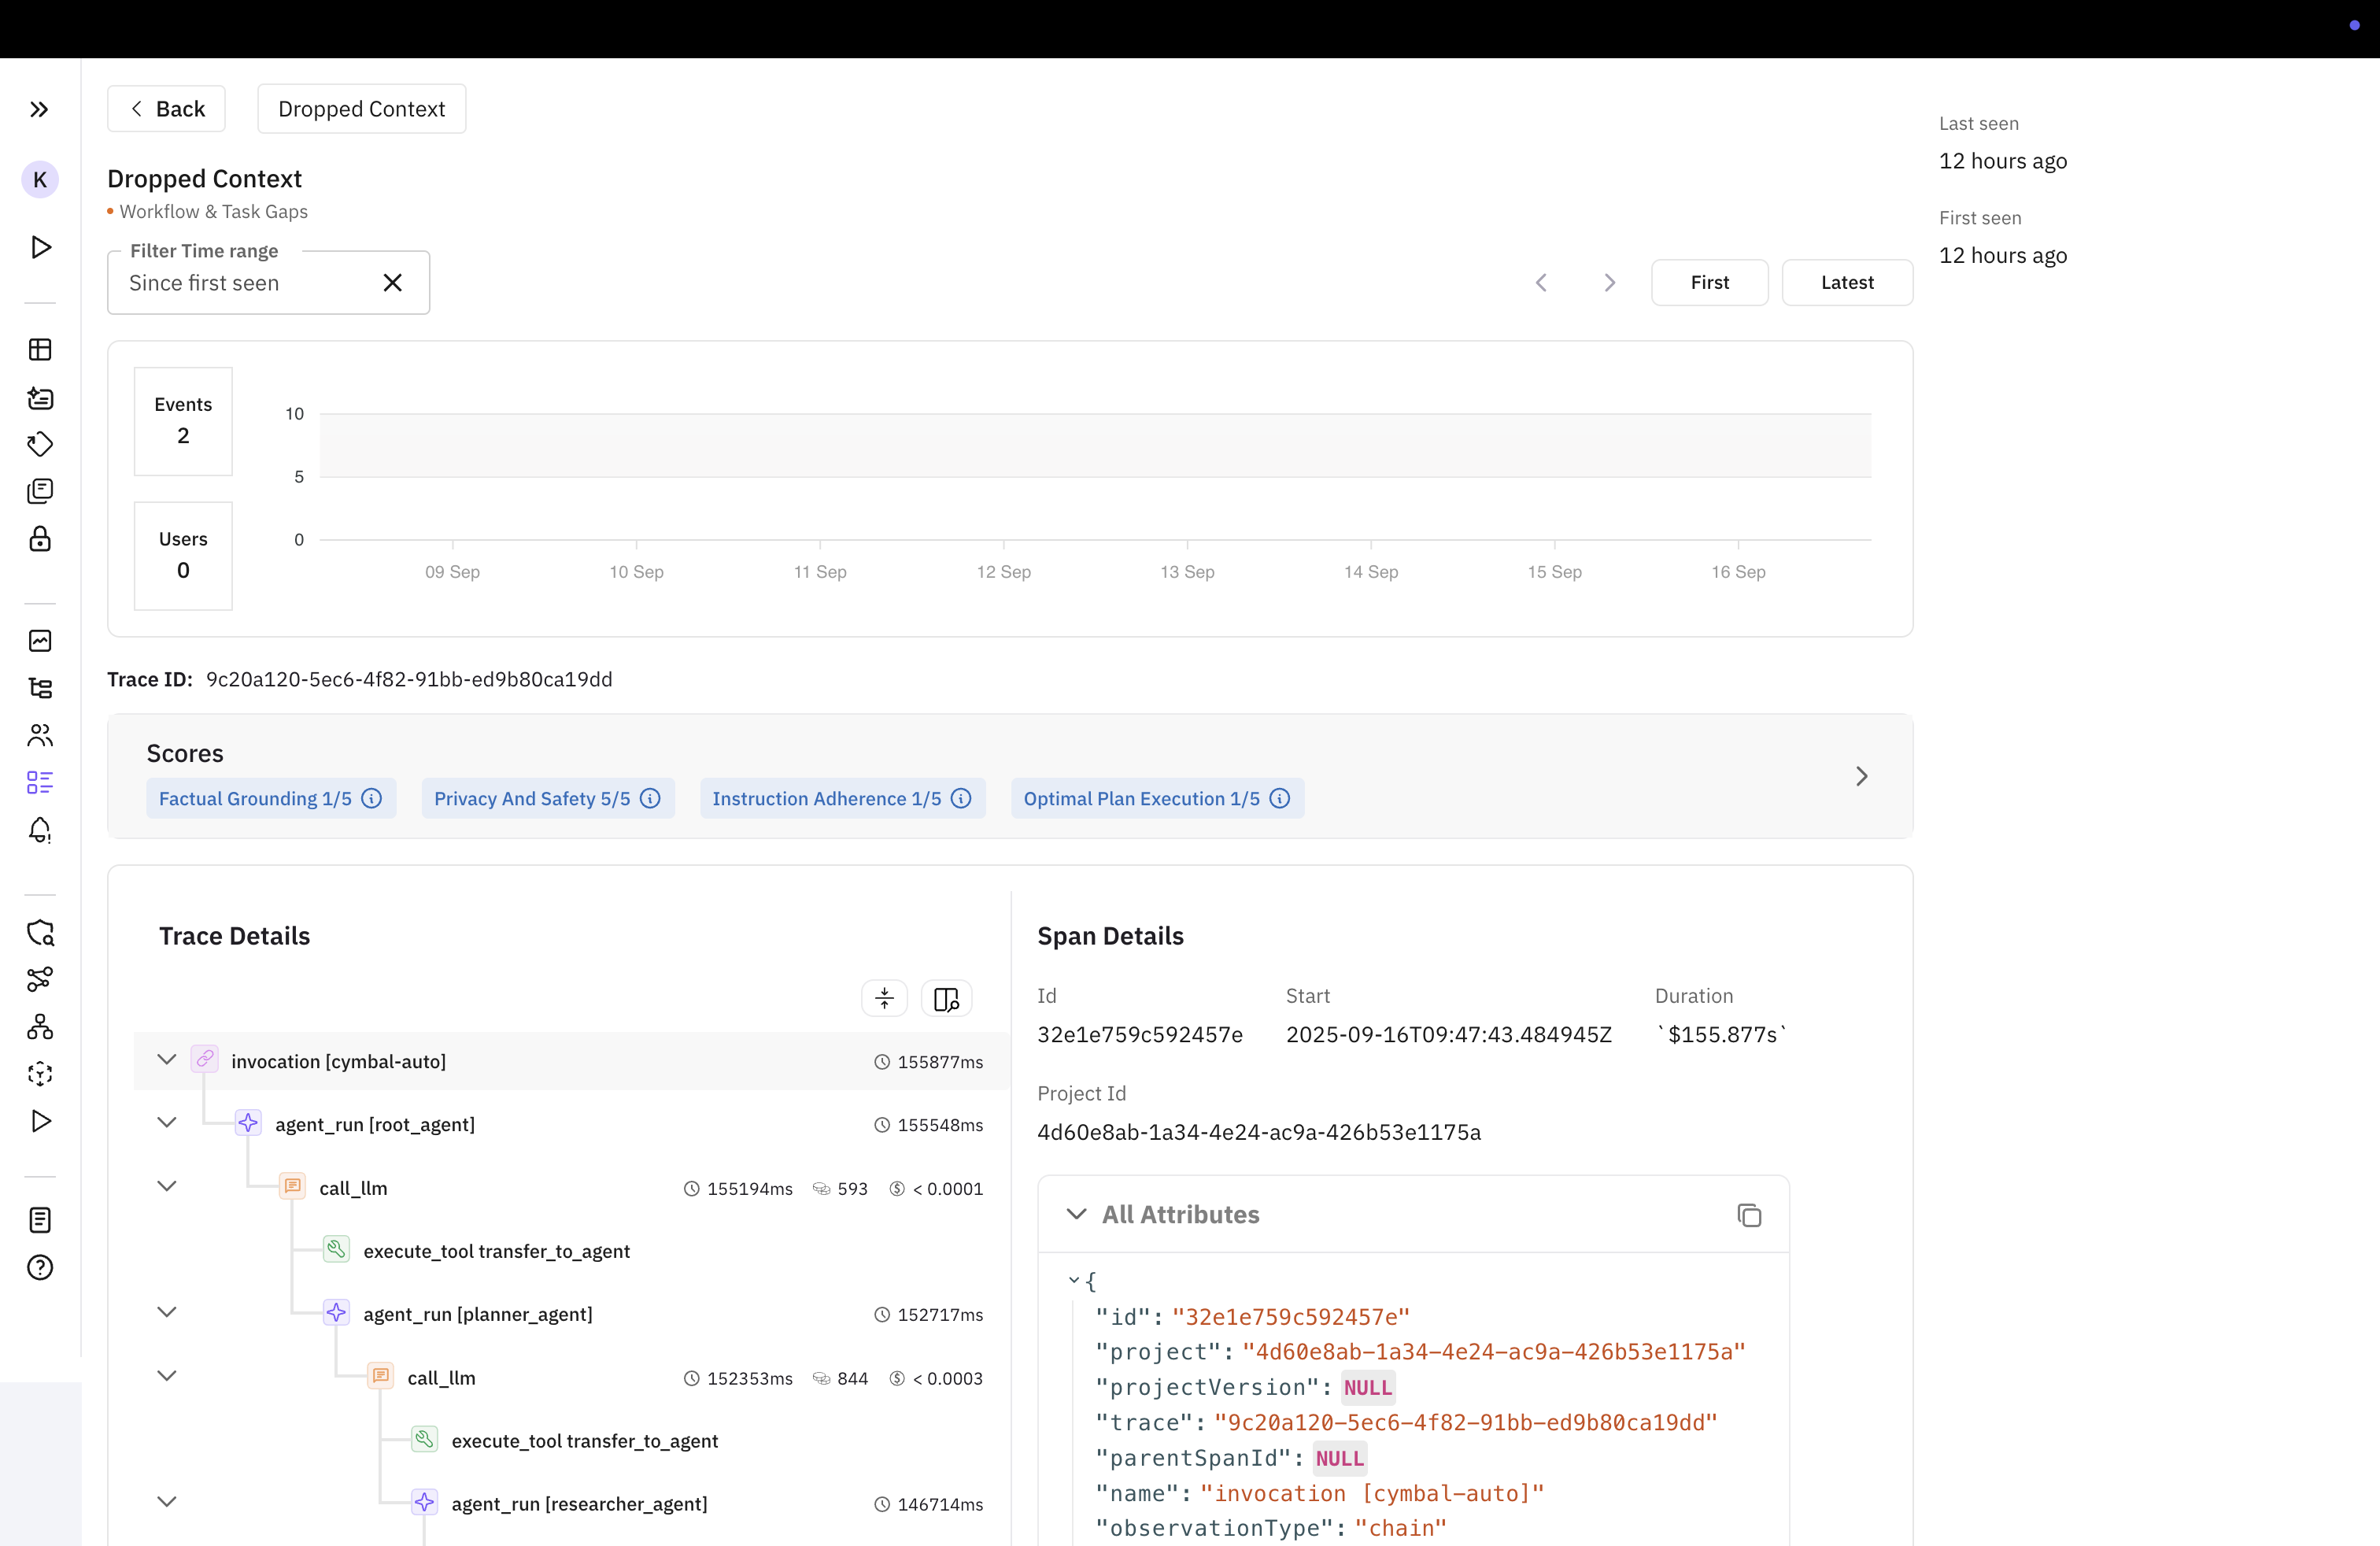
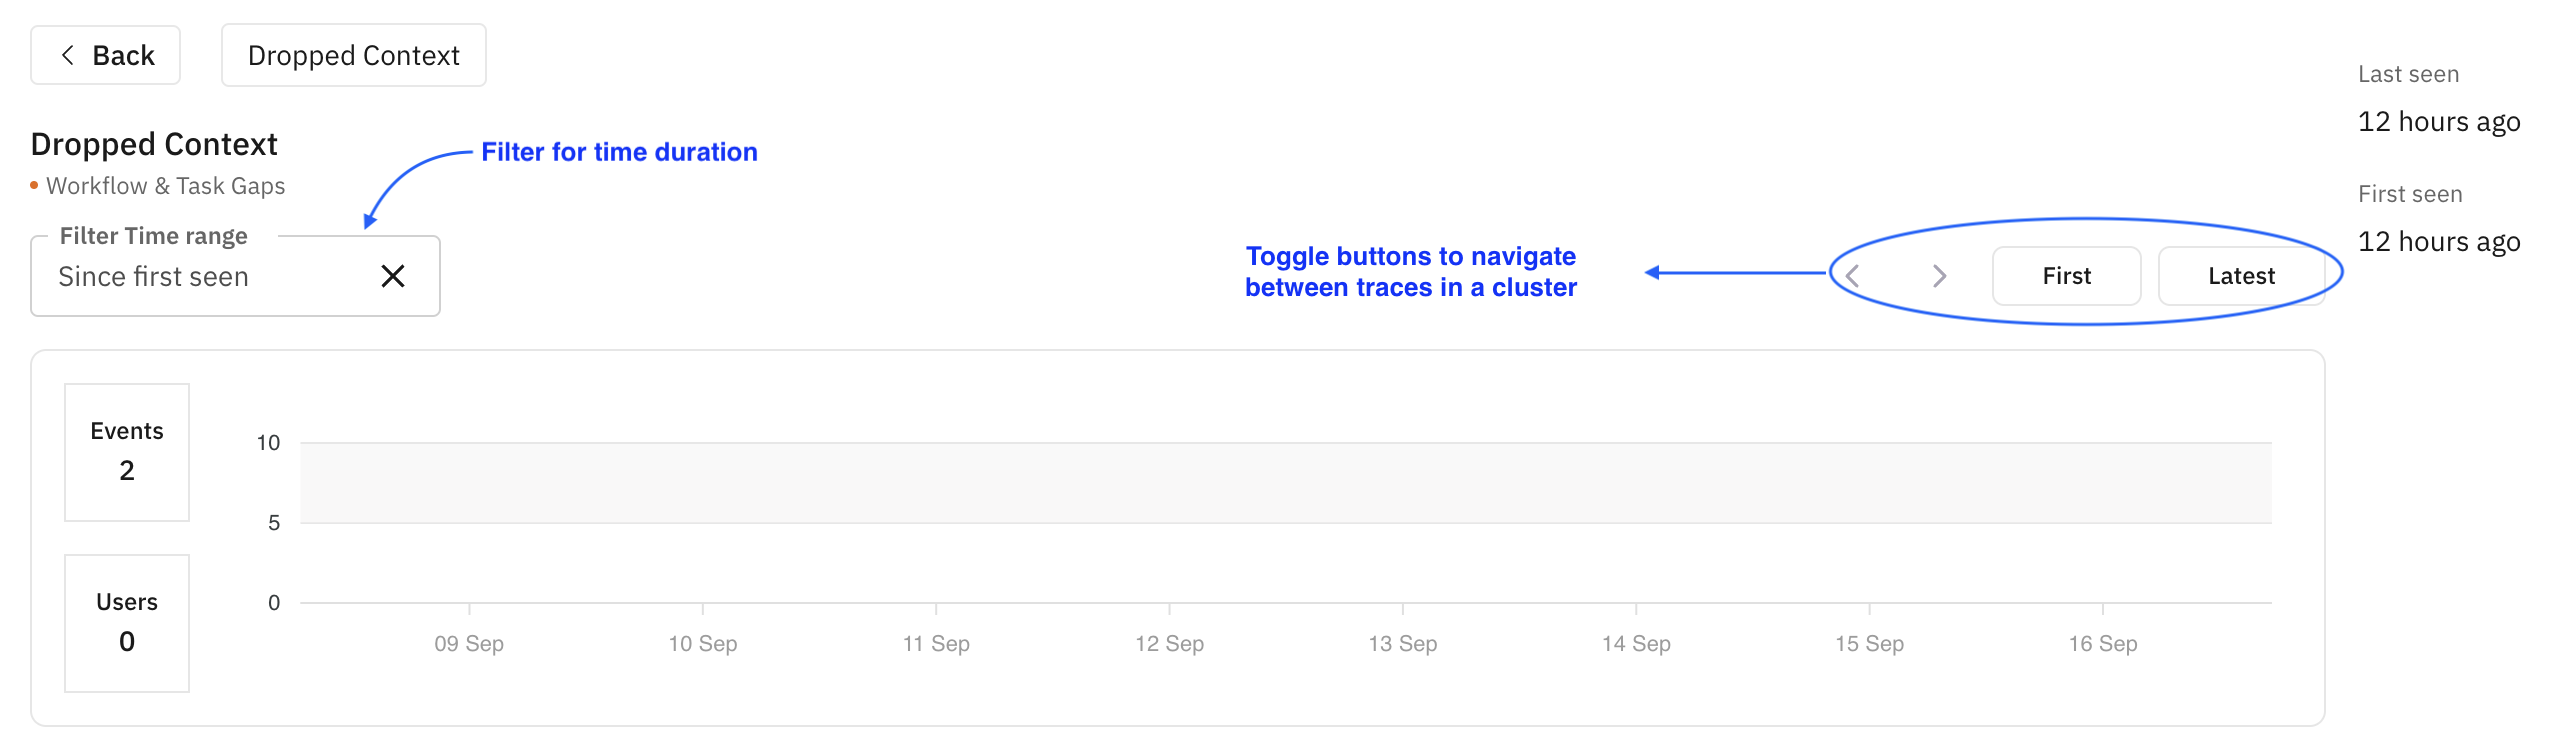
Mulitple traces can have the same error. All those traces are grouped under a common cluster. TheError Name shown in the image above is essentailly the name of the cluster. The listing page of the tab provides options to filter the clusters based on project and age of the lastest error.
Events
This term is used to indicate the number of occurances of the particular errorTrends
The number of times a particular error occured. The cycle of that is referred as trend (example: increasing, decreasing etc.) Clicking on each of the cluster takes us to a details page which gives more information about the error and the associated trace(s) with it. By default, the latest trace associated with the error cluster will be shown. There are also other features that will be explained one by one.